


Andreas Gohr has posted an interesting article to his site showing you how you can easily visualize XDebug stack traces and make them a bit more clear than the usual output dump.
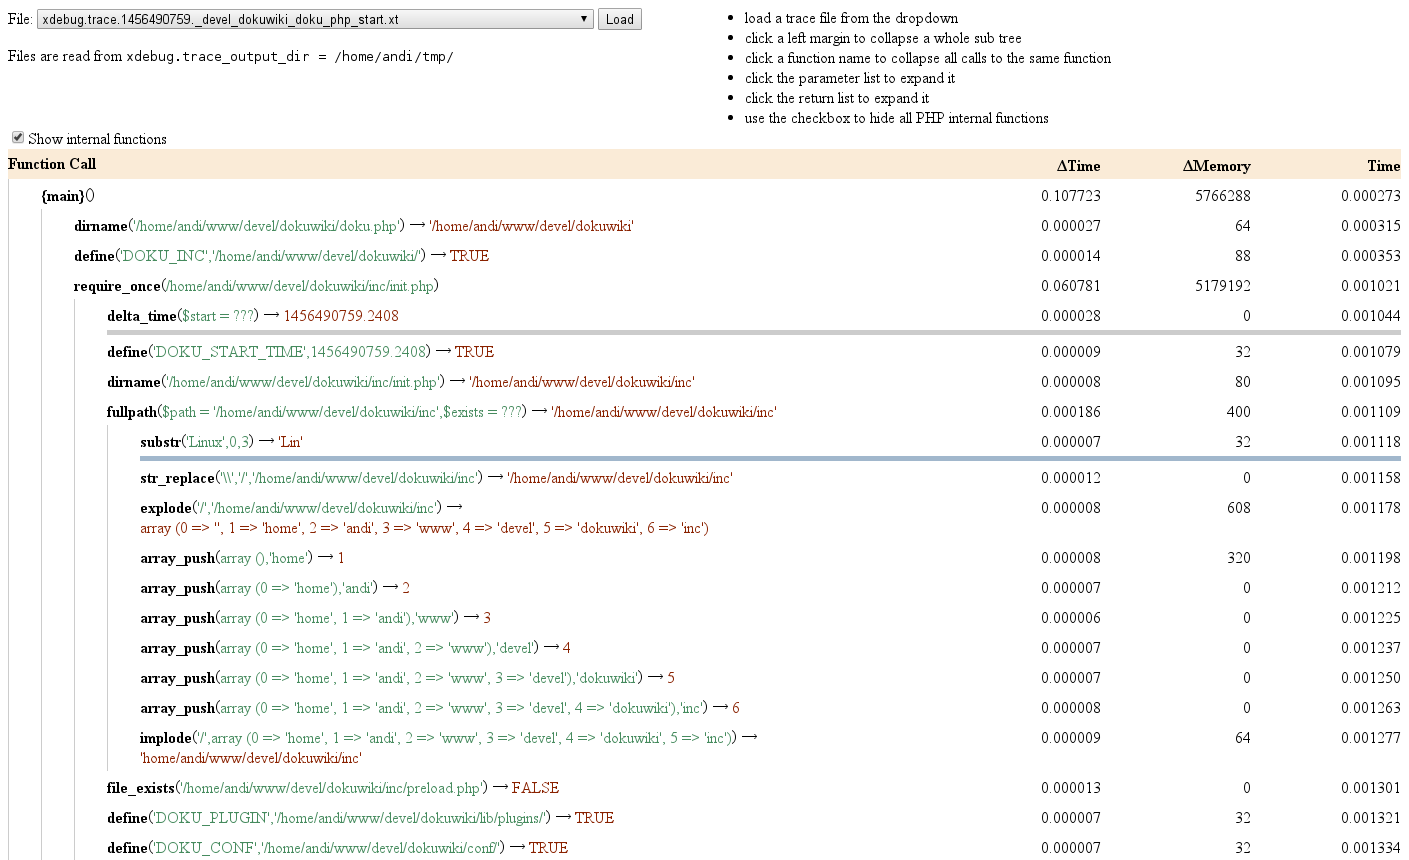
As alluded to in yesterday's post, I'm currently hunting an elusive bug with xdebug. The problem is, that it only happens sporadically and when I know it happened it is too late to set a break point. So usual debugging methods don't work. Instead I want to use xdebug's execution tracing: let it log all function calls and then pick through the log when the bug occurs.[...] To ease my debugging I looked for tools that could read the computer readable format. I found a few promising candidates, but in the end they either didn't work or they did not provide what I needed. So instead of hunting the bug, I built a tool
His tool takes in the XDebug output and turns it into something much more readable and properly nested.