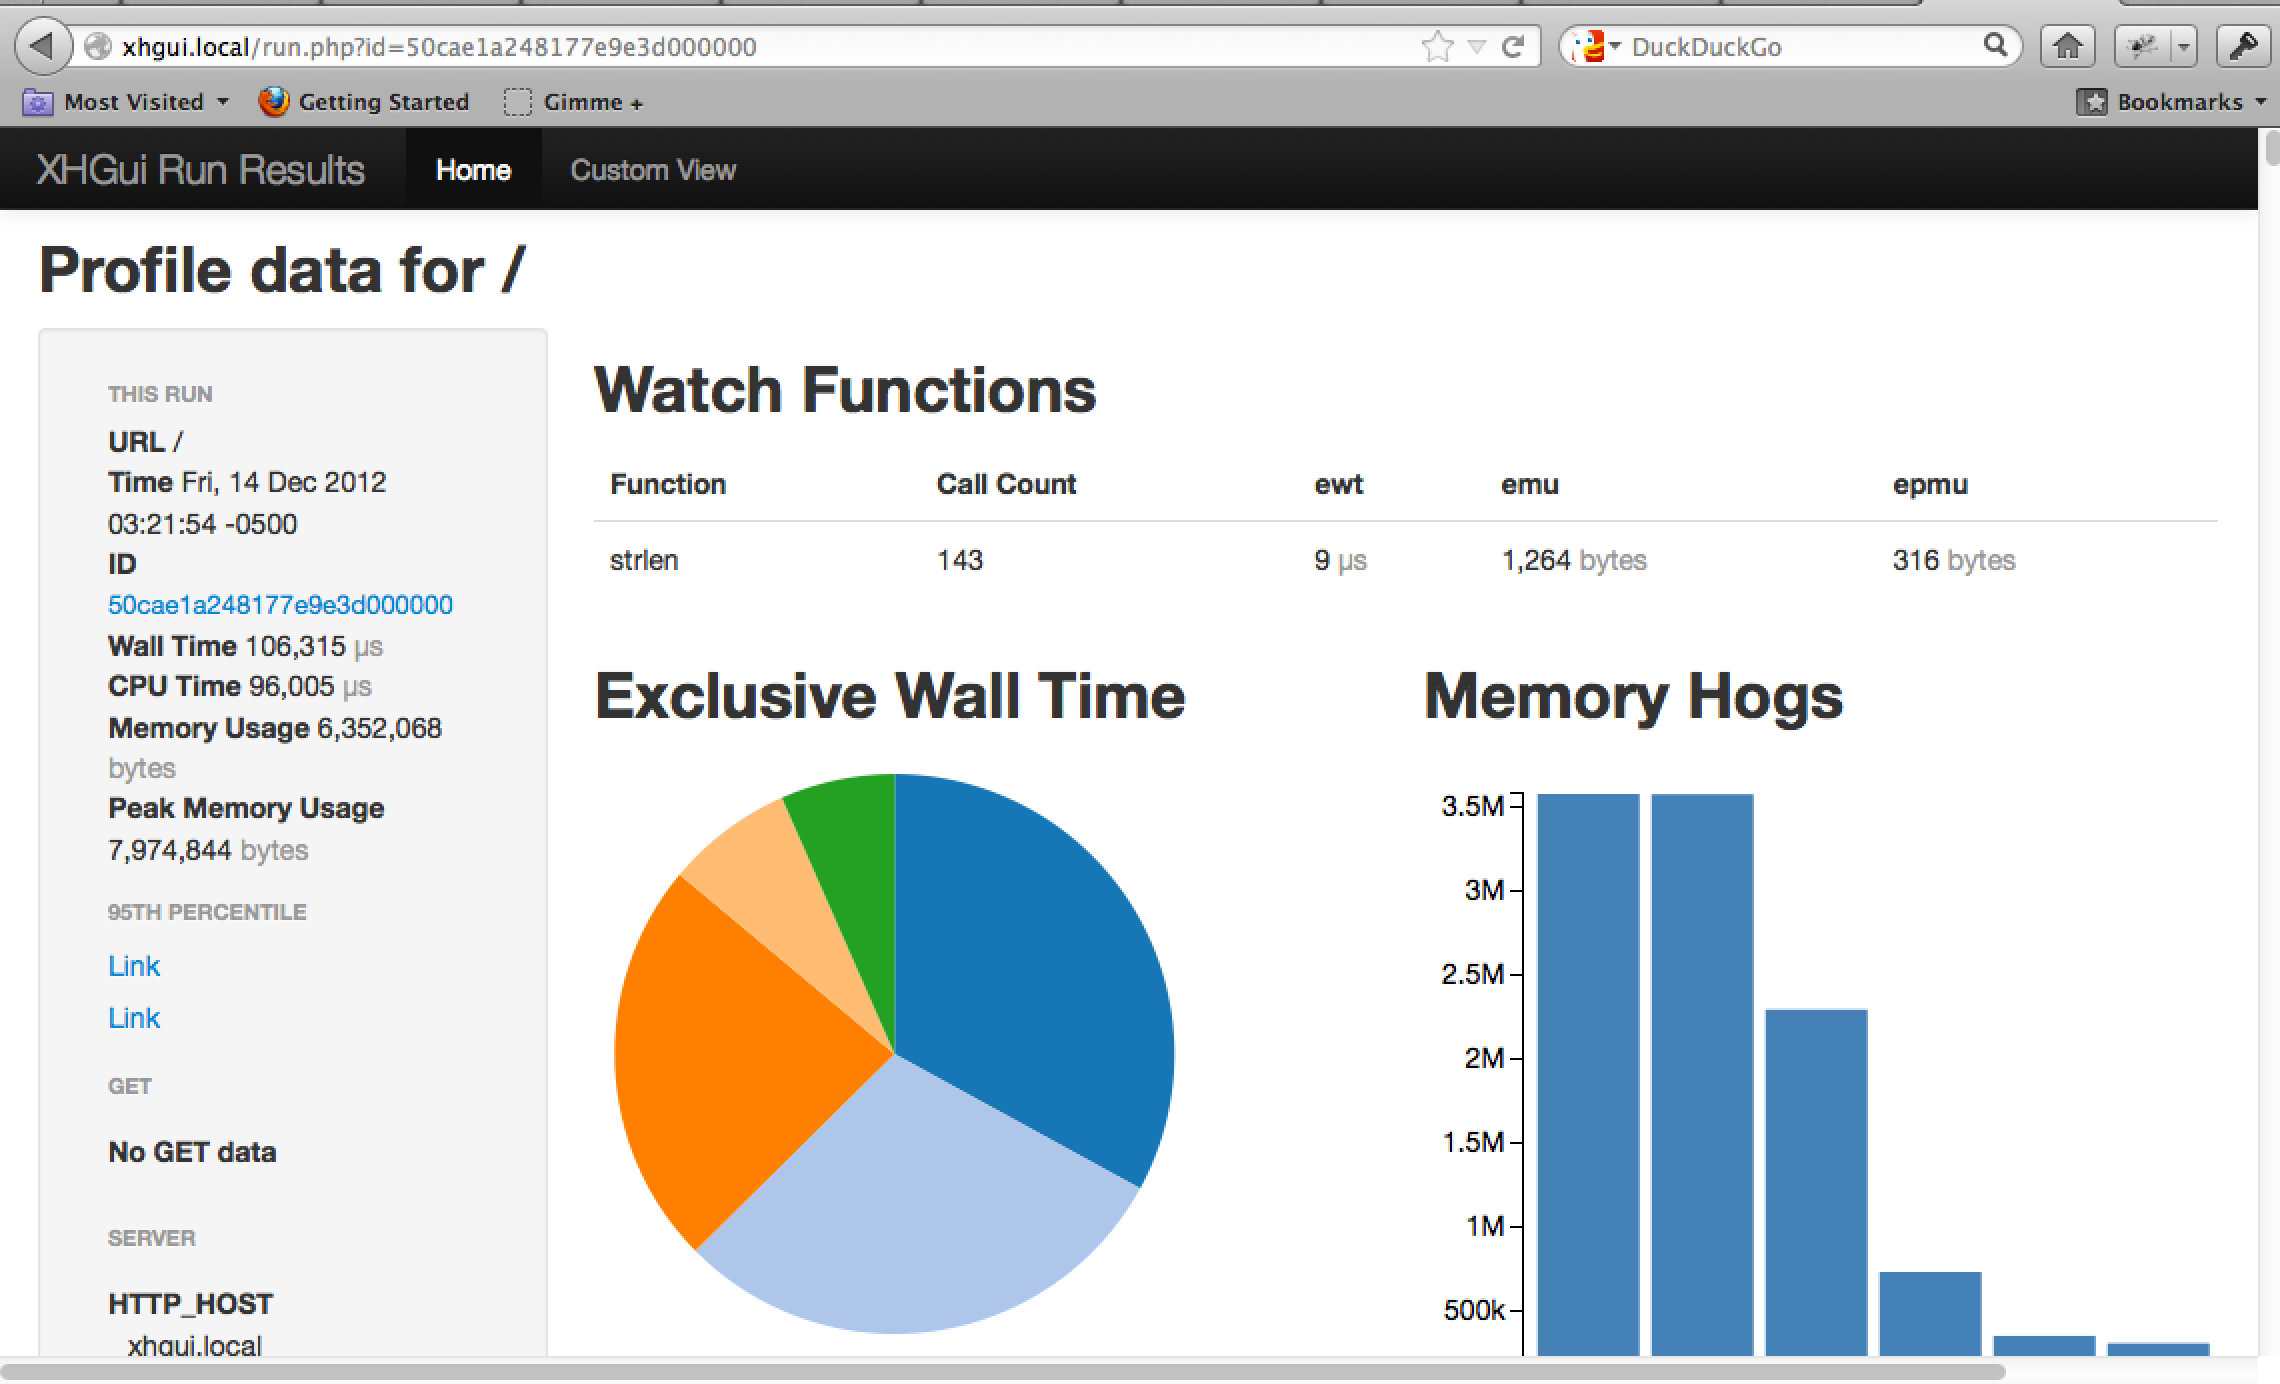
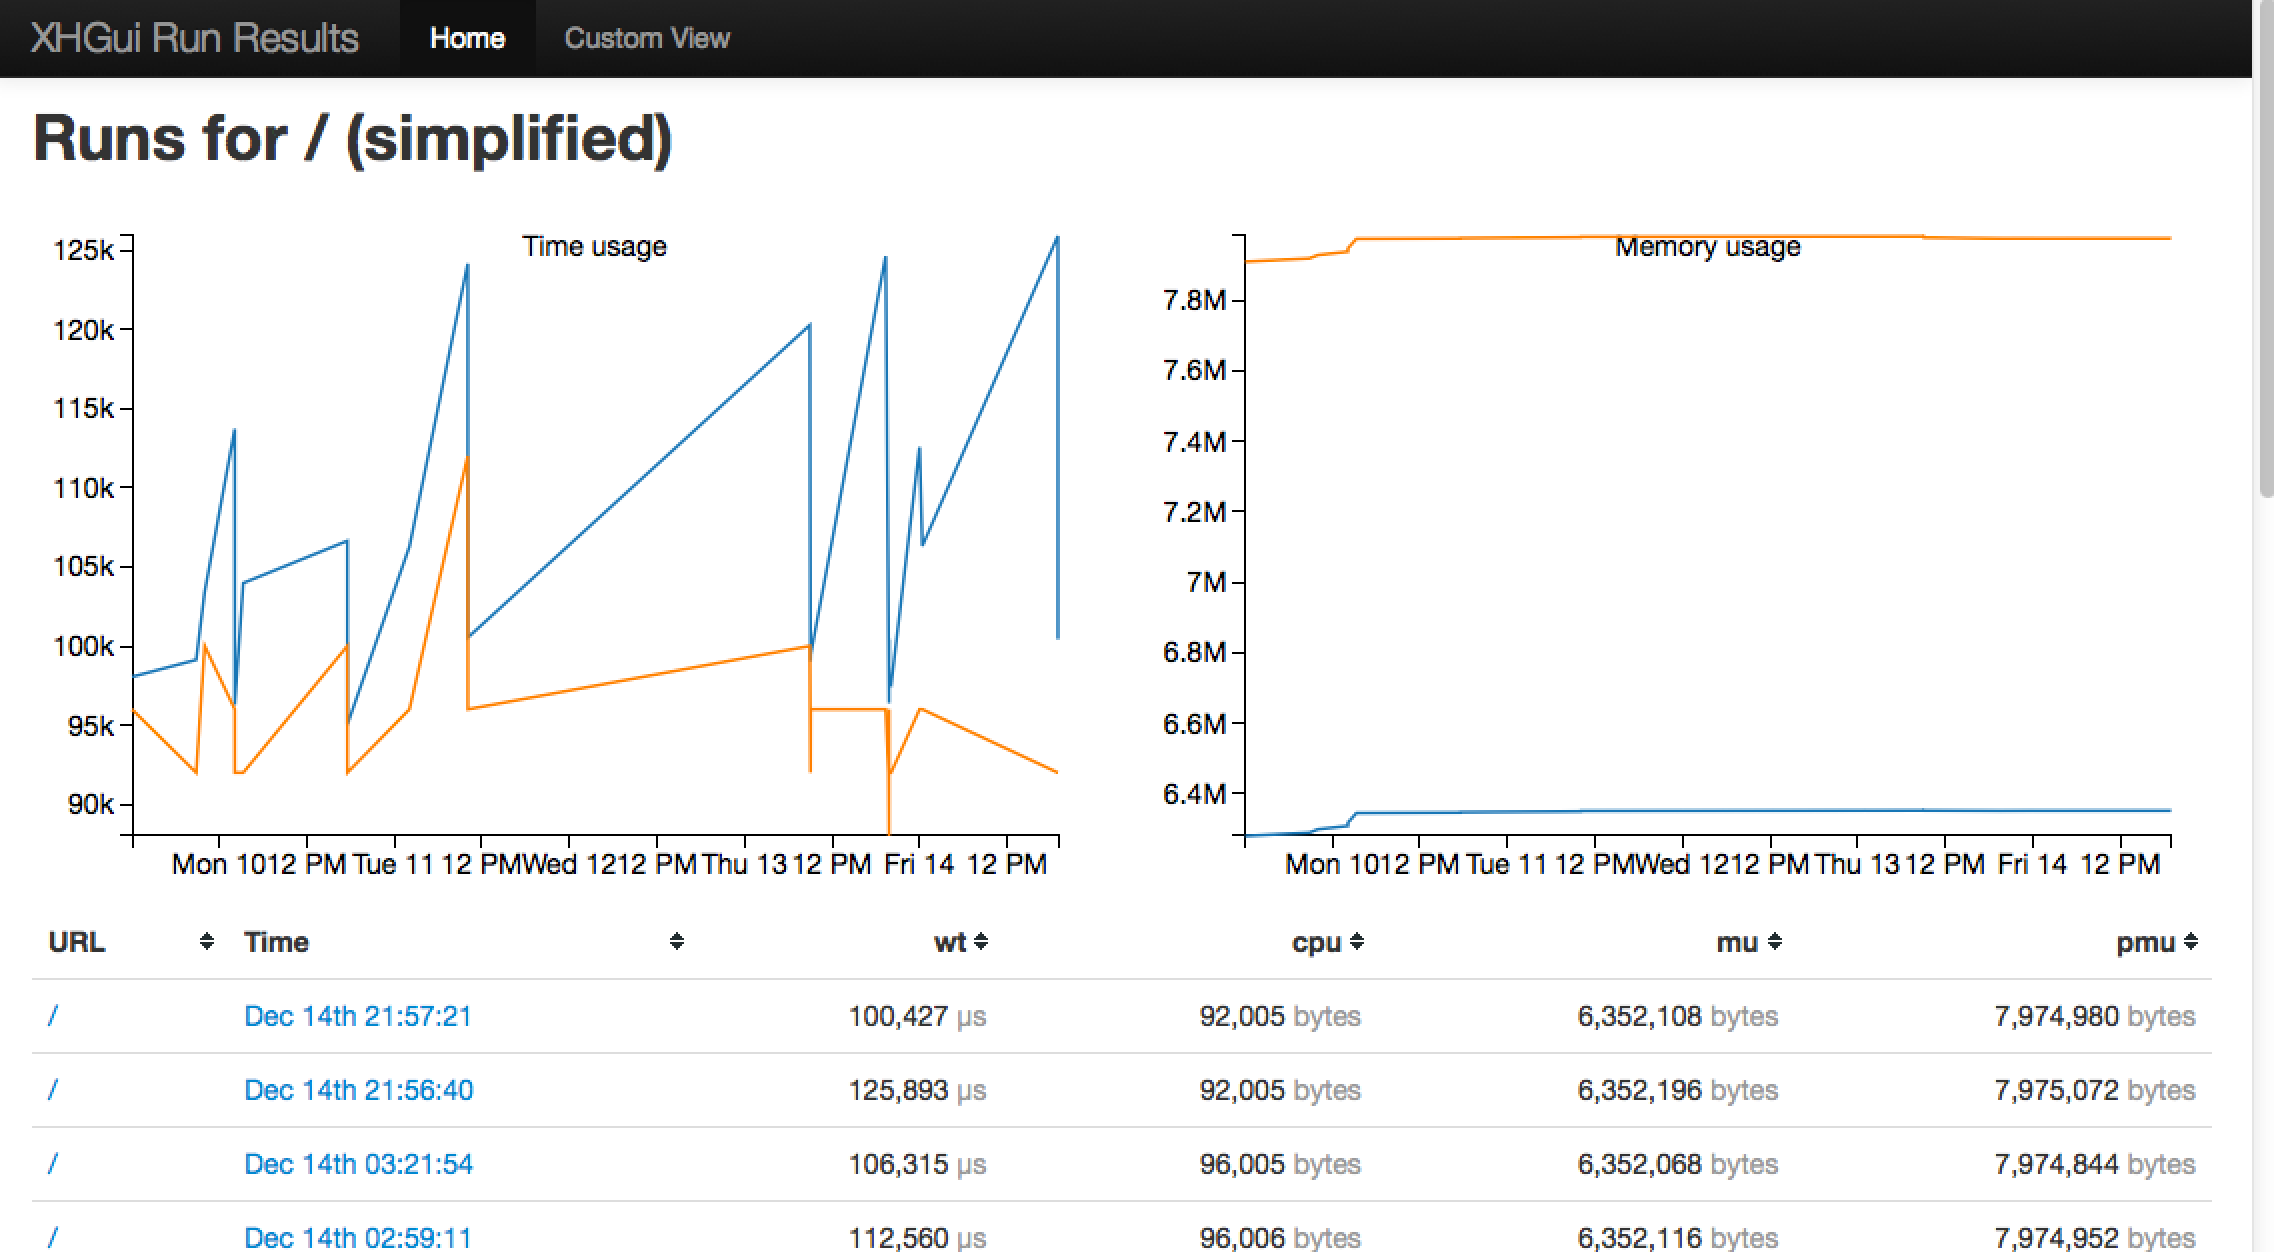
News Feed
Jobs Feed
Sections


News Archive
feed this:

Lorna Mitchell:
Installing XHGui
March 07, 2013 @ 12:15:01

Lorna Mitchell has a new post today showing you how to install XHGui to help with profiling your application for performance and processing issues.

If you're not familiar with XHGui it's a fabulously easy and friendly way to profile your application; to understand which method calls in a page take the time and how many times they are made, so you can improve the performance of your application. All these instructions are for my 32-bit Ubuntu 12.10 system, hopefully they will work for you or you'll be able to adapt them as appropriate.

She lists the dependencies you'll need to have installed before you can get XHGui working correctly including a MongoDB instance and the PECL xhprof extension. With those all set to go, you can go grab the latest XHGui from github and drop it into place.

0 comments voice your opinion now!
xhgui xhprof profile application installation pecl mongodb


Paul Reinheimer:
XHGui and MongoDB
December 26, 2012 @ 10:02:01

Paul Reinhemier has written up post sharing his creation of the code to get XHGui working with MongoDB.

Mark Story & I are pleased as punch to introduce XHGui on MongoDB. Our goal was to get as close to the original feature set of the tool I worked on a few years ago (which leveraged the starting point provided by Facebook) and then to release what we had. What we've got now works; there's still a good distance to go, but we think it's far enough that we can ask for help form the community at large.

The tool collects XHProf data and stores it into a MongoDB database and allows you to view recent activity. There's a few warnings that he includes with the post, so be sure to read those through if you plan on using the tool.

0 comments voice your opinion now!
xhgui mongodb database nosql profile xhprof data performance


PHPMaster.com:
The Need for Speed Profiling with XHProf and XHGui
September 03, 2012 @ 10:29:13

On PHPMaster.com today Matt Turland has an article posted about using XHProf and XHGui to find the performance issues in your application and profile them to help optimize things.

Profiling is the process of measuring the execution time of each function or method call involved in servicing a single page request. The data collected from this process can reveal issues such as a particular method taking a long time to execute or being called a large number of times. Profiling a PHP script generally requires installing a PHP extension. The two more popular extensions for this purpose are Derick Rethans' Xdebug and Facebook's XHProf. This article will focus on XHProf.

He walks you through the installation of both and shows you some sample results of the profiling of a simple application and how you can compare the results across profiling runs. Additionally, if you install graphviz support, you can generate the call stack output in a visual form to make for easier consumption.

0 comments voice your opinion now!
xhprof profile optimize xhgui tutorial install


DZone.com:
Profiling a PHP Application
April 18, 2011 @ 11:09:33

On DZone.com's Web Builder Zone today there's a new post from Eric Hogue talking about some of the tools you can use to profile your PHP application and squeeze that much more performance out of it (or maybe just find that pesky, elusive bug).

When developing web applications, we often run into performance issues. People often blame PHP or MySQL for bad performance, but in most case the answer is not that easy. Blindly trying to optimize random parts of our applications can lead to some uneven results. There are many available tools to profile a PHP application. Learning how to use them can help us pinpoint which parts are slow. With this information we can pick the optimizations that will give us the best results.

The helpful tools he mentions include:

0 comments voice your opinion now!
profile application siege xhprof xhgui xdebug


Eric Hogue's Blog:
Profiling a PHP Application
April 01, 2011 @ 10:02:53

Eric Hogue has written up a new post about a few different technologies you can use to profile your PHP applications quickly and easily.

There are many available tools to profile a PHP application. Learning how to use them can help us pinpoint which parts are slow. With this information we can pick the optimizations that will give us the best results. This post describes the installation and configuration of some of them. I tested them in a Ubuntu 10.10 virtual machine. If you want to try those tools, don't forget that they can greatly impact the performance of you web server when they are active. Installing a tool like Xdebug on a production server is not recommended.

First he looks at benchmarking your application with a tool called Siege, a load testing tool that can be configured to send requests to your application in lots of different ways. He also mentions Xdebug, a handy debugger and XProf, a profiling tool to help find the bottlenecks in your code (and XHGui to view its results).

0 comments voice your opinion now!
profile application xdebug siege xprof xhgui


Community Events


Don't see your event here?
Let us know!


unittest interview opinion series introduction application example tool release development code testing framework phpunit zendframework2 object community language podcast functional

All content copyright, 2013 PHPDeveloper.org :: info@phpdeveloper.org - Powered by the Solar PHP Framework