Looking for more information on how to do PHP the right way? Check out PHP: The Right Way

Matthew Turland:
PHPUnit + XHProf = BOOM!
Oct 14, 2015 @ 14:38:22

Matthew Turland has a post to his site sharing his experience with the PHPUnit and XHProf combination...and the unfortunate result that made every test fail.

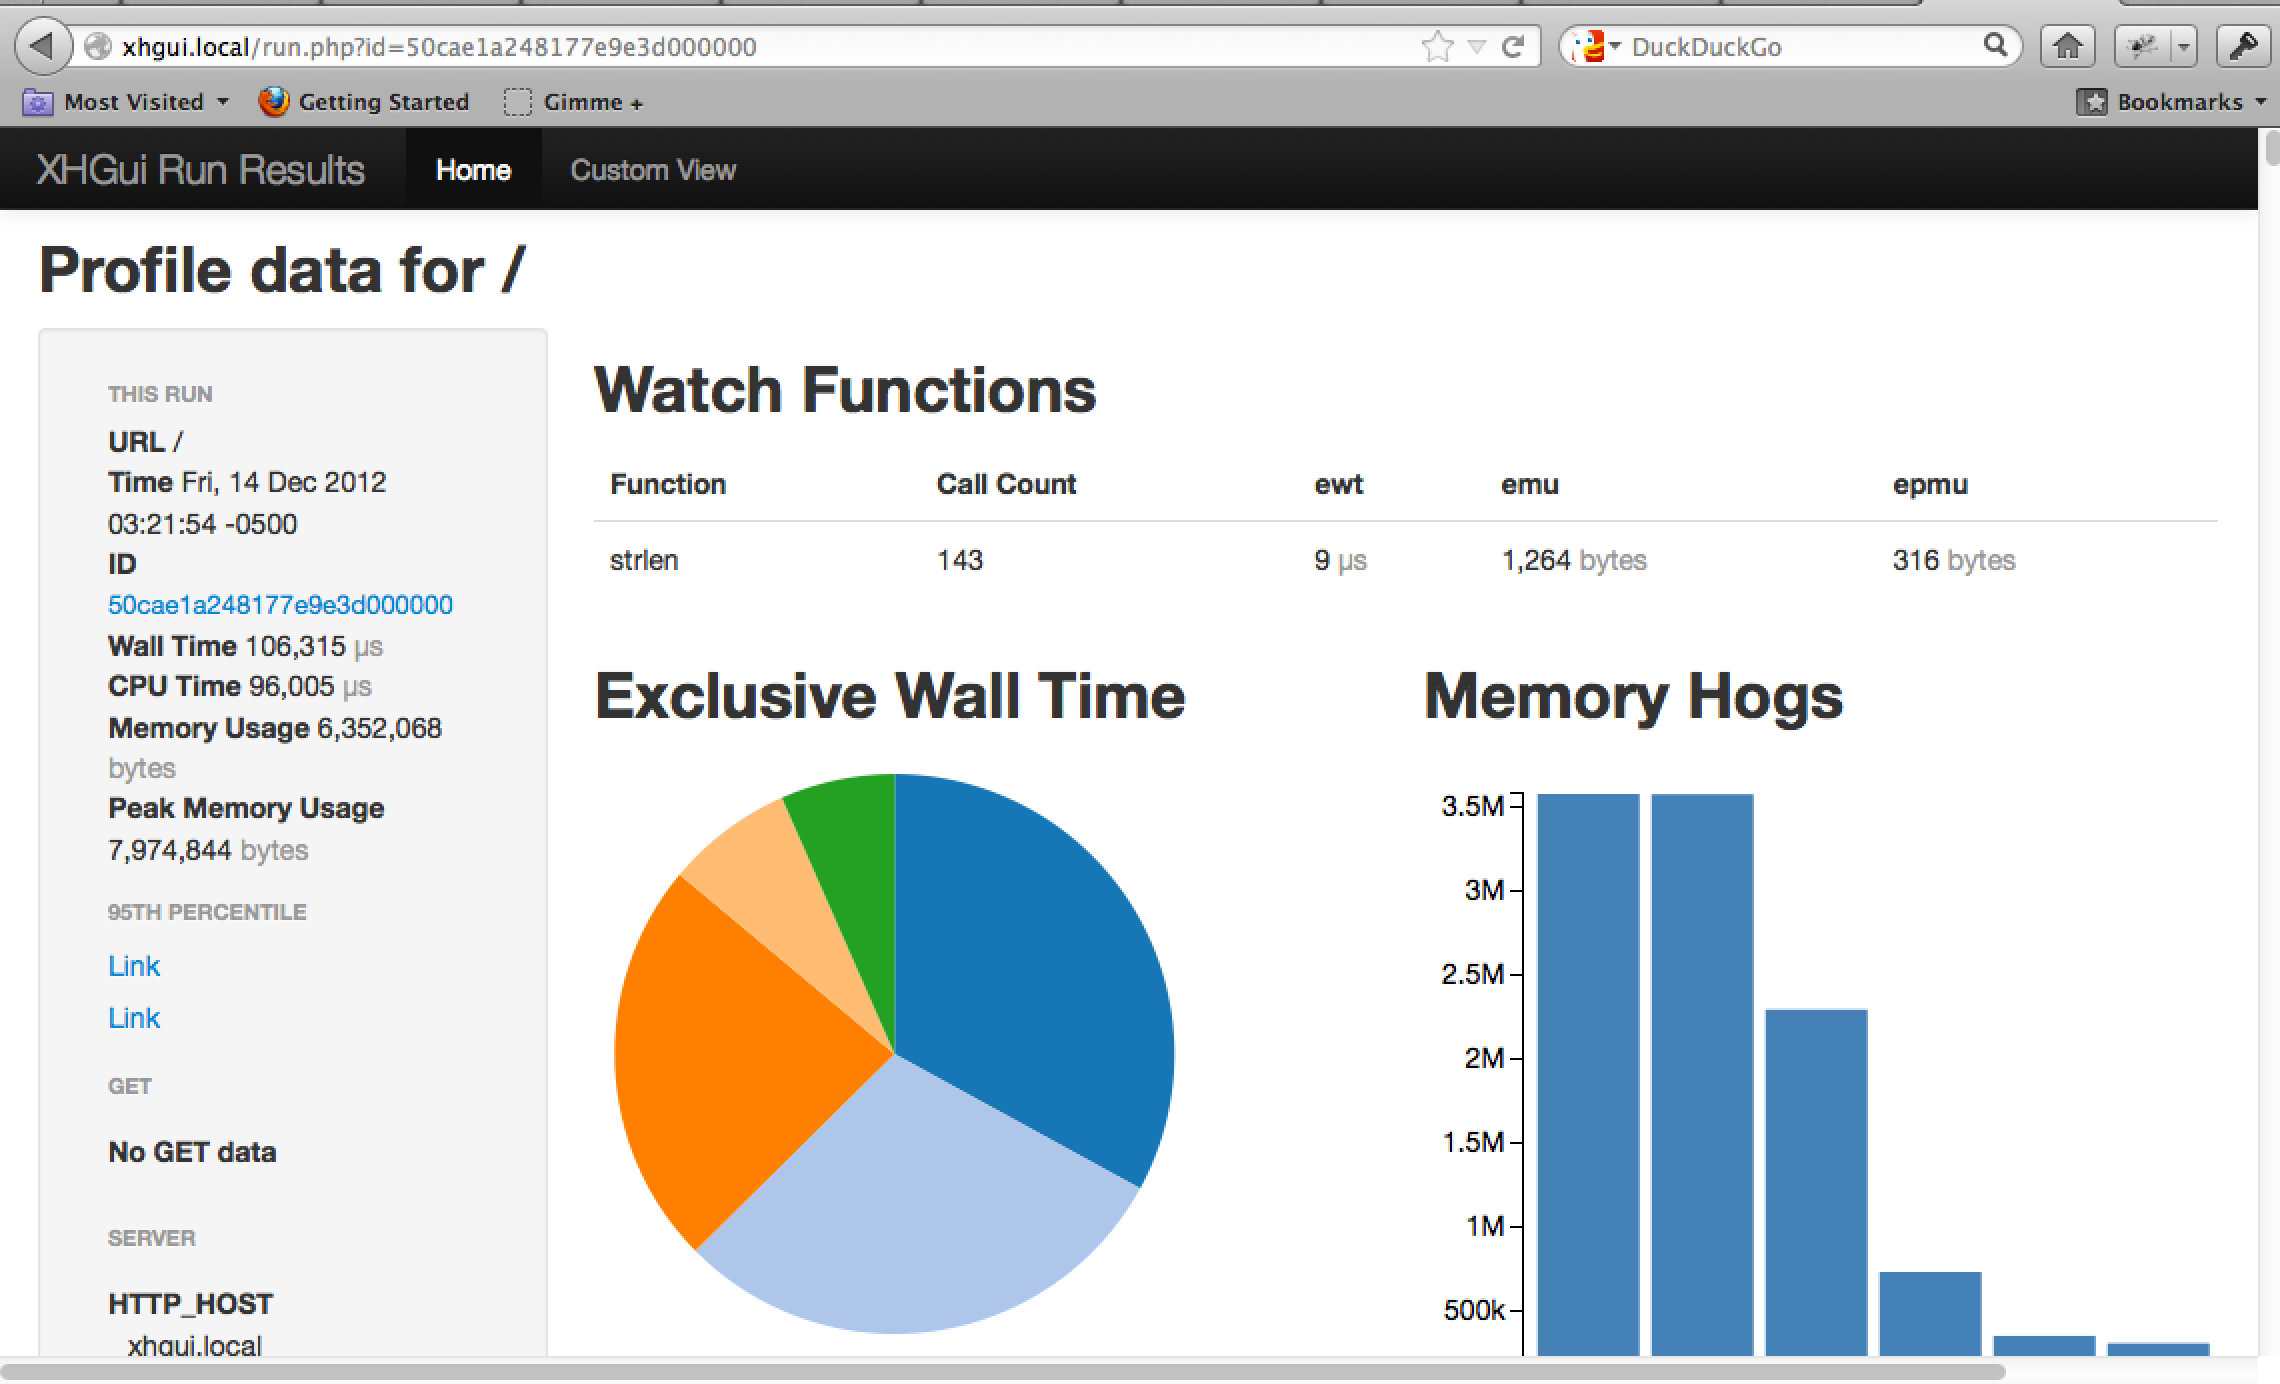
I ran into an issue recently while trying to run PHPUnit tests in an environment using XHProf. Google didn’t prove to be much help, so I thought I’d document the problem and solution here for posterity.

When I ran my tests, each failed with the same cryptic error and no backtrace: "Attempted to serialize unserializable builtin class PDO" The cause was the culmination of two rather unfortunate circumstances.

He shares the two problems that causes this issue - one being XHProf's use of globals (where its PDO connection is stored) and the other is the @backupGlobals setting in PHPUnit that's enabled by default. This makes PHPUnit to try to backup that PDO connection by serializing it but can't, hence the failure. He points out a pull request that aims to fix the issue but recommends disabling the globals backup for the time being if you don't have a need for it.

tagged: phpunit xhprof combine globals pdo error backup

Link: http://matthewturland.com/2015/10/13/phpunit-xhprof-boom/

Platform.sh:
Creating flamegraphs with XHProf
Jul 30, 2015 @ 15:08:27

The Platform.sh blog has a post showing you how to create flamegraphs with XHProf for your application's execution and overall performance. A "flamegraph" is just a different sort of graph stacking up the execution times for the methods and functions in your application so they look more like a "flame" than just numbers.

One of the most frequent needs a web application has is a way to diagnose and evaluate performance problems. Because Platform.sh already generates a matching new environment for each Git branch, diagnosing performance problems for new and existing code has become easier than ever to do without impacting the behavior of a production site. This post will demonstrate how to use a Platform.sh environment along with the XHProf PHP extension to do performance profiling of a Drupal application and create flamegraph images that allow for easy evaluation of performance hotspots.

While they show it at work on a Platform.sh instance, the method can be altered slightly to work with your own application with the right software installed. Their example uses the brendangregg/FlameGraph library to do the majority of the graphing work. He shows how to have the code switch on XHProf during the execution and where to put the file for later evaluation. They include the resulting directories and files created from the execution and how to view the resulting (SVG-based) graphs directly in a browser.

tagged: xhprof flameframe execution performance graph tutorial platformsh

Link: https://platform.sh/2015/07/29/flamegraphs/

Rob Allen:
Installing XHGui via Ansible
Apr 14, 2015 @ 15:50:47

Rob Allen has posted a guide to his site today showing how to install XHGui via Ansible. XHGui is a graphical interface to view the results of XHProf, a performance evaluation tool.

I'm still using Ansible to provision Vagrant VMs. This is how I added the XHGui profiler to my standard setup.

He walks you through the five steps his process follows to get the necessary software installed and configured to get up and running:

  • Install Composer
  • Install the uprofiler PHP extension
  • Install XHGui
  • Set up for profiling
  • Set up host for XHGui website

Each step includes the commands to execute or the lines to add/update to the configurations to get the system up and working.

tagged: tutorial install xhgui xhprof ansible build vagrant vm virtualmachine

Link: http://akrabat.com/installing-xhgui-via-ansible/

Lorna Mitchell:
XHGui on VM, Storage on Host
Jan 05, 2015 @ 18:09:08

Lorna Mitchell has a new post today showing you how you can use XHGui in a virtual machine, sorting the resulting performance data on the VM rather than your local machine.

I'm doing some performance tuning on a project at the moment and my favourite tool is still XHGui - but it's designed to run on the same machine as its victim and since this is a vagrant VM, the chances of me destroying the machine and therefore the data are pretty high! Instead, I set it up to store the data onto the host and I thought I'd share how I did that. All these instructions for Ubuntu on both host and guest, and I've tried not to be specific about the vagrant elements in order to focus on how the pieces fit together rather than what you should type.

She walks you through all the steps you'll need to get the software up and running as well as configuring the actual guest VM to direct the data to the right place. She sets up the data source to push the results into (a MongoDB) and configures the PHP installation with an "auto prepend" of the XHGui header file. Finally, she includes the commands you'll need to view the data on the VM itself, running the built-in PHP web server as an ad-hoc instance on the VM itself.

tagged: xhgui xhprof mongodb vm virtualmachine tutorial localhost

Link: http://www.lornajane.net/posts/2015/xhgui-on-vm-storage-on-host

Qandidate.com:
Setting up XHProf/XHGui profiling with Ansible
Nov 28, 2013 @ 23:56:51

On the Qandidate.com blog there's a new post showing how to set up the PHP profiling tool XHProf/XHGui using Ansible for setup and configuration. Ansible is a radically simple IT orchestration engine that makes your applications and systems easier to deploy.

Once in a while I think about profiling my web applications to see if I can get them to run faster. There are cool tools out there like XHProf and XHGUI to help you do exactly that. And then I remember it took me quite some time to get it all set up... But now that I've started using Ansible I decided to document the set up process and share it with you. Today I will walk you through my Ansible role for setting up everything you need for profiling your first PHP script.

He starts with a checklist of things to be sure you have installed first (including XHProf and XHGui) and links to his yml configuration to run a "profiling" command. An example of the result (the XHGui HTML output) is also included.

tagged: xhprof xhgui ansible install configure tutorial

Link: http://labs.qandidate.com/blog/2013/11/28/setting_up_xhprof_xhgui_profiling_with_ansible/

Adam Culp:
XHProf PHP Profiling
Aug 05, 2013 @ 14:03:35

Adam Culp has posted to his site about some of his experiences with XHProf and profiling his PHP applications.

Today I set up my development environment so I can use XHProf to profile PHP scripts when needed, and it was pretty easy. [...] XHProf is a PECL package, and can be easily installed by using standard PECL commands.

He walks you through the installation of the PECL package (you'll need to use the command line for this one) and how to add the module to your php.ini to enable it. Once you restart your web server, you can start the debugging using the xhprof_enable function and then the xhprof_disable function to end the testing and retrieve the data for processing. He also includes a bit of output from his own pass-through script to show the results.

tagged: xhprof profiling install tutorial debug

Link: http://www.geekyboy.com/archives/718

Lorna Mitchell:
Installing XHGui
Mar 07, 2013 @ 18:15:01

Lorna Mitchell has a new post today showing you how to install XHGui to help with profiling your application for performance and processing issues.

If you're not familiar with XHGui it's a fabulously easy and friendly way to profile your application; to understand which method calls in a page take the time and how many times they are made, so you can improve the performance of your application. All these instructions are for my 32-bit Ubuntu 12.10 system, hopefully they will work for you or you'll be able to adapt them as appropriate.

She lists the dependencies you'll need to have installed before you can get XHGui working correctly including a MongoDB instance and the PECL xhprof extension. With those all set to go, you can go grab the latest XHGui from github and drop it into place.

tagged: xhgui xhprof profile application installation pecl mongodb

Link:

Paul Reinheimer:
XHGui and MongoDB
Dec 26, 2012 @ 16:02:01

Paul Reinhemier has written up post sharing his creation of the code to get XHGui working with MongoDB.

Mark Story & I are pleased as punch to introduce XHGui on MongoDB. Our goal was to get as close to the original feature set of the tool I worked on a few years ago (which leveraged the starting point provided by Facebook) and then to release what we had. What we’ve got now works; there’s still a good distance to go, but we think it’s far enough that we can ask for help form the community at large.

The tool collects XHProf data and stores it into a MongoDB database and allows you to view recent activity. There's a few warnings that he includes with the post, so be sure to read those through if you plan on using the tool.

tagged: xhgui mongodb database nosql profile xhprof data performance

Link:

PHPMaster.com:
The Need for Speed: Profiling with XHProf and XHGui
Sep 03, 2012 @ 15:29:13

On PHPMaster.com today Matt Turland has an article posted about using XHProf and XHGui to find the performance issues in your application and profile them to help optimize things.

Profiling is the process of measuring the execution time of each function or method call involved in servicing a single page request. The data collected from this process can reveal issues such as a particular method taking a long time to execute or being called a large number of times. Profiling a PHP script generally requires installing a PHP extension. The two more popular extensions for this purpose are Derick RethansXdebug and Facebook’s XHProf. This article will focus on XHProf.

He walks you through the installation of both and shows you some sample results of the profiling of a simple application and how you can compare the results across profiling runs. Additionally, if you install graphviz support, you can generate the call stack output in a visual form to make for easier consumption.

tagged: xhprof profile optimize xhgui tutorial install

Link:

NetTuts.com:
Advanced CodeIgniter Profiling With XHProf
Apr 18, 2012 @ 18:12:18

On the NetTuts.com site today there's a new tutorial showing how to use XHProf to profile CodeIgniter-based applications and fidn the spots that are causing the most overhead/issues.

XHProf will provide you with a hierarchical profile of the functions your application calls, allowing you to follow the chain of events that lead up to resource intensive code running. You’ll be able to see exactly how much wall time (the actual time elapsed), CPU time and memory your application uses. This tutorial will help you get XHProf installed on your server, and integrated with your CodeIgniter application via hooks so that you can start profiling your application, in a production environment, straight away. Everything you see here was written for Ubuntu 10.04 – the latest LTS release at the time of writing.

They walk you through the installation of the tool (via a wget of the source), show you how to integrate it with CodeIgniter via hooks and include a simple class that is called to execute and report on the findings. Some sample output is included as well as some general tips on interpreting the results.

tagged: codeigniter profile xhprof framework

Link:


Trending Topics: