Looking for more information on how to do PHP the right way? Check out PHP: The Right Way

Liip Blog:
Let’s debug in Drupal 8 !
Jun 20, 2016 @ 14:23:37

In a new post to the Liip blog Karine Chor shares some helpful Drupal 8 debugging tips and things you can do to determine what you code is doing "under the covers".

It has been nearly 7 months since Drupal 8 first release and as a developer, I am still in the learning process. It can be hard sometimes to know what is going wrong with your code and how to solve it. I will tell you about few things to know on how to develop and debug Drupal 8 projects and continue learning, learning and learning !

Her tips cover topics like:

  • Disabling cache
  • Displaying errors
  • Creating log messages
  • Debugging Twig templates
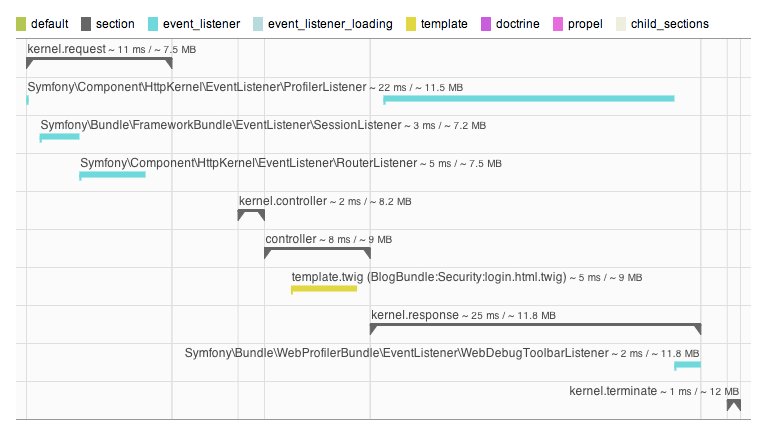
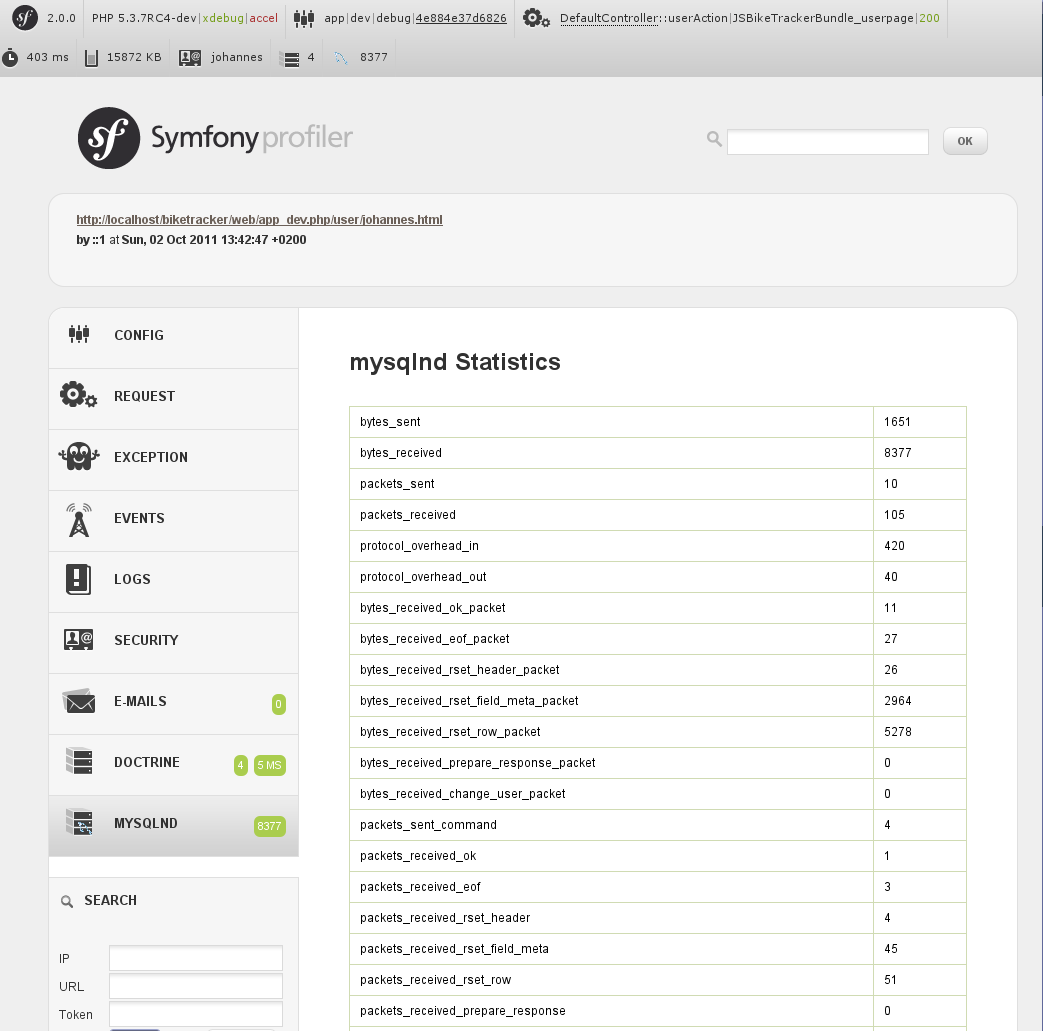
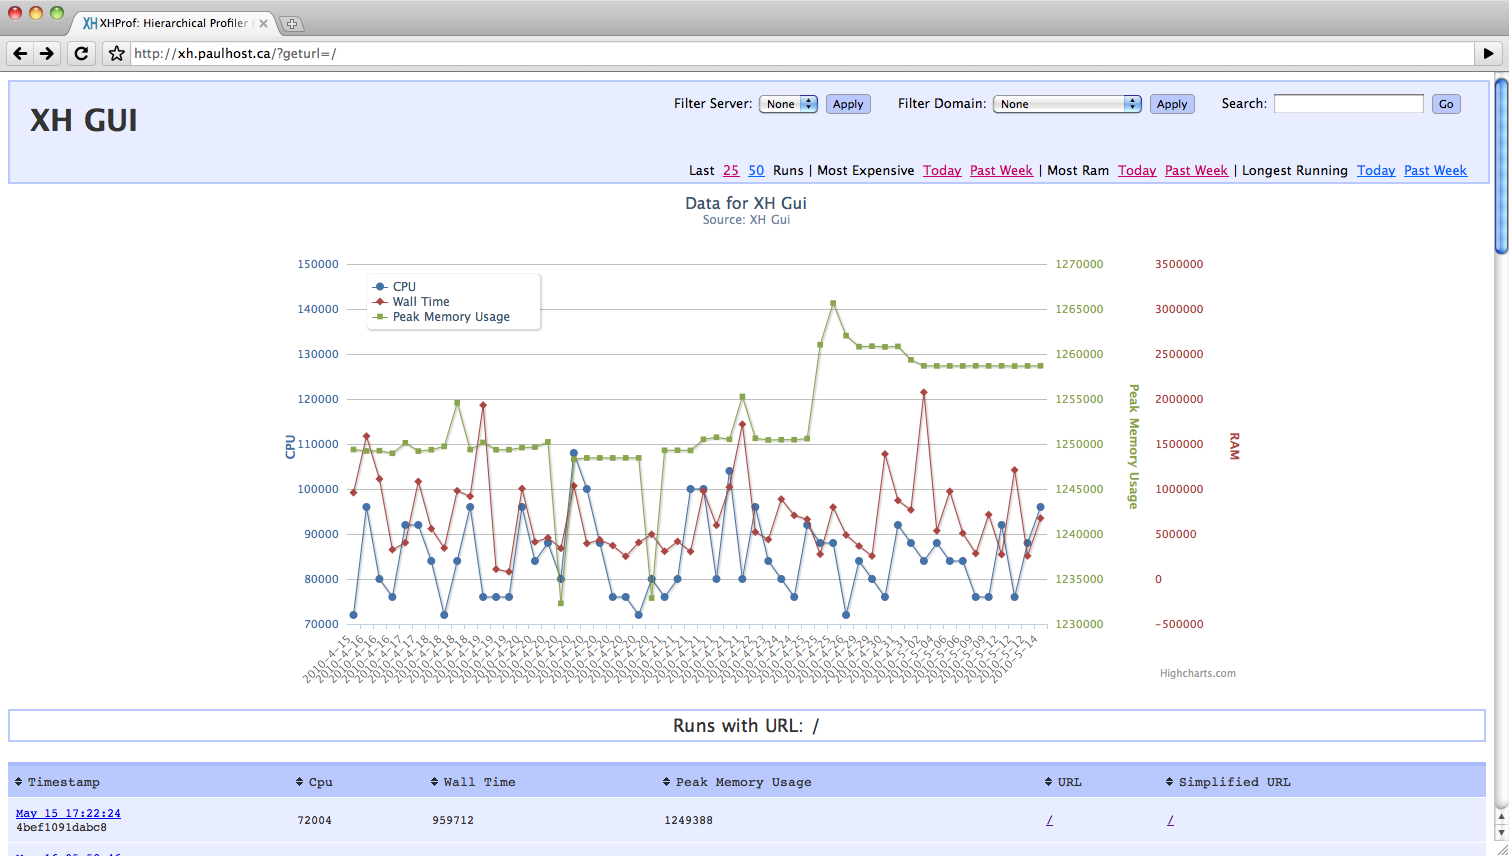
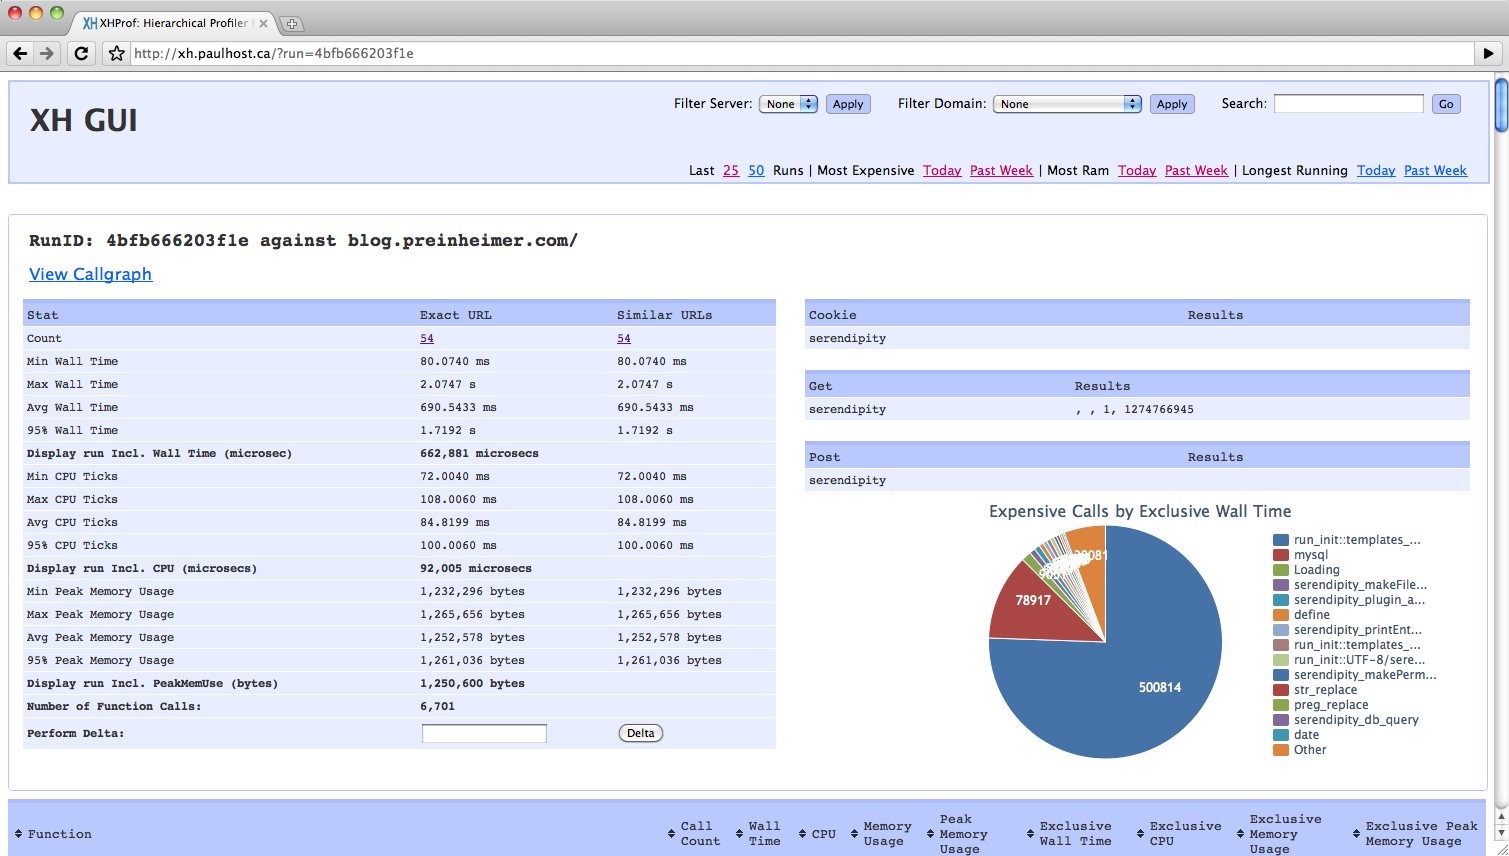
  • Profiling pages

The post ends with a section covering use of the the Drupal command line tool to provide even more real-time debugging functionality.

tagged: debugging drupal8 commandline cache error log twig profiler tutorial

Link: https://blog.liip.ch/archive/2016/06/20/lets-debug-drupal-8.html

Derick Rethans:
Xdebug 2.3: Profiler File Compression
Apr 14, 2015 @ 14:48:09

Derick Rethans has posted the next part of his series of posts about the latest version of XDebug (v2.3). In this new post he focuses on the profiler and the new ability of it to compress the resulting file.

When making profiling dumps with Xdebug, the file size can not really be ignored. Even with a simple Drupal page a profile file is easily close to 1Mb. For each function call, the file contains the location and name of the calling function, and then a list of functions that have been called.

He gives an example of the uncompressed output from an execution of Drupal, showing the duplicate content when the same method is called more than once. With this new feature, XDebug is smart enough to detect this and make use of name compression to essentially replace duplication with a reference to the previous call to the same bits of code.

tagged: xdebug profiler compression feature release

Link: http://derickrethans.nl/xdebug-2.3-profile-file-compression.html

stfalcon.com:
Increasing project productivity in Symfony2 from Doctrine2 ORM
Mar 16, 2015 @ 18:55:36

In this tutorial to the stfalcon.com site Sasha Lensky talks about some things you can do to help boost the performance of your Symfony2 application with a few tweaks in how Doctrine is used.

I have been trying to write this article for a long time, but just couldn’t get around. Finally, I pulled myself together and did it. So, what will we discus ... I will share some techniques about working with Doctrine2 ORM, which will help to improve the site performance on Symfony2 (precisely any site that uses Doctrine2 ORM). I have created a project and put it on GitHub as a visual guide, so anyone can test my words in action now.

He shares five tips and includes code examples and results (based on the Profiler toolbar) for each:

  • Downloading all necessary connections
  • Updating multiple entities by request
  • Hydration waiver
  • Using Reference Proxies
  • Using Symfony Profiler Toolbar

That final tip about the Profiler toolbar is actually one used in the rest of the examples too, showing how to get that other information from the tool.

tagged: doctrine2 symfony2 orm performance tips profiler toolbar

Link: http://stfalcon.com/en/blog/post/performance-symfony2-doctrine2-orm

Fabien Potencier:
Debugging Silex applications just got fun
Feb 08, 2013 @ 17:54:38

On his site Fabien Potencier has posted about a feature added to Silex to help make debugging the flow of your application "more fun" - the Symfony web profiler.

One of the big advantages of both Symfony and Silex is that they are based on the Symfony HttpKernel component. [...] But handling HTTP requests with the Symfony HttpKernel also gives you a lot of free and optional features like a built-in reverse proxy written in PHP, easy handling of ESI and Hincludes (via the Fragment sub-framework), or the gorgeous Symfony web profiler.

The profiler provides information on which components were accessed, their memory consumption and how long they took to execute. The integration happens via the WebProfiler provider for Silex and is already integrated into the Silex skeleton base application.

tagged: silex debug profiler microframework httpkernel skeleton

Link:

DZone.com:
Speed Up Your PHP Like Facebook
Nov 29, 2011 @ 16:13:03

On DZone.com John Esposito reminds you about another technology Facebook has introduced to the world of PHP (besides HipHop) - XHProf, a PHP profiler.

Facebook did more for PHP: they also created XHProf, a PHP profiler with a (supposedly) easy-to-use HTML interface, designed to pinpoint exactly where your bottlenecks are appearing, so that you can optimize at every stage in the pipeline. [...] If you haven't tried XHProf, you might want to look into it. Installation apparently requires a little nudging, but Nick Lewis just posted a full, practical guide to benchmarking and performance tuning your PHP and MySQL, using XHProf (as well as other techniques) -- a very nice overview of many common bottlenecks and how to open them up.

There's also a link to some Drupal 6 benchmarks that shows how it has helped that project (including both small and large improvements).

tagged: facebook hiphop xhprof profiler speed performance

Link:

Johannes Schlüter's Blog:
Symfony 2 and mysqlnd
Oct 03, 2011 @ 14:22:52

Johannes Schlüter has a new post to his blog today about a bundle he's created for the Symfony2 framework that integrates some of the advanced statistics mysqlnd provides back to the framework's profiler tool - JSMysqlndBundle.

Symfony provides a nice feature, which is the Symfony Profilier, an extensive logging and reporting system for Symfony developers to understand what's going on. A part of it is the Doctrine query logger which lists all database queries executed by Doctrine and their execution time. This is nice but when we're using mysqlnd in our PHP build we have more information available. "So why not use that information," I thought and built a new bundle for Symfony 2 doing exactly that.

His bundle takes the "150 or so" statistics and drops them into the profiler, giving you even more insight into how your script is running. The bundle is available on github, making it simpler to fork and extend to add other features (some he suggests include caching and replication decisions using information from other mysqlnd plugins).

tagged: mysqlnd symfony2 profiler mysql bundle

Link:

Paul Reinheimer's Blog:
XHGui Improvements
Jun 15, 2010 @ 16:03:01

Paul Reinheimer has posted about some updates to a profiler project he's been working on, XHProf, with some new GUI improvements thanks to Highcharts. XHProf is a function-level hierarchical profiler for PHP and has a simple HTML based user interface.

I merged my Highcharts branch into master today, including a bunch of improvements to the GUI for XHProf including: using Highcharts for graphing URLs over time, which allows for multiple axis per graph, adding a pie chart to the individual run page to show where time was spent on page load, ability to merge various calls for display within the pie chart (e.g. mysql_* into mysql), switched to the javascript tablesorter for the single run results, filter to allow you to view results only from a specific server or domain

You can see two screenshots of this new feature in action here and here. If you'd like to give the tool a try, you can grab the latest version from github.

tagged: gui improvement xhprof profiler highcharts

Link:

Xml.it Blog:
Open-source PHP profiler
Sep 18, 2007 @ 23:56:00

The xml.it blog passes on a quick tip for something that was exactly what they were looking for:

We were looking for a simple open-source PHP profiler, without any fancy IDEs like Zend bundled together. After a little search, we found one: Xdebug, debugger and profiler tool for PHP.

XDebug is "extension helps you debugging your script by providing a lot of valuable debug information. The debug information that Xdebug can provide includes the following: stack traces, memory allocation and protection for infinite recursions".

tagged: opensource profiler xdebug debugger tool cachegrind opensource profiler xdebug debugger tool cachegrind

Link:


Trending Topics: